Chandra Data: Behind the Scenes of W49B
Joe DePasquale, Science Imager for NASA's Chandra X-ray Observatory, gives a pictorial tour behind the scenes on processing our latest Chandra press release image, supernova remnant W49B
I thought it might be useful to take a quick look at the various components that went into making the image for W49B. The release has sparked some attention and discussion on black holes, as well as how (and why) images such as these are colored. The processing of W49B included a combination of Chandra's CIAO software, PixInsight and Photoshop. The colors applied are representative, as we are translating something invisible to our eyes into something we can see. The image combines X-rays from NASA's Chandra X-ray Observatory in blue and green, radio data from the NSF's Very Large Array in pink, and infrared data from Caltech's Palomar Observatory in yellow. Enjoy, and feel free to ask any questions.
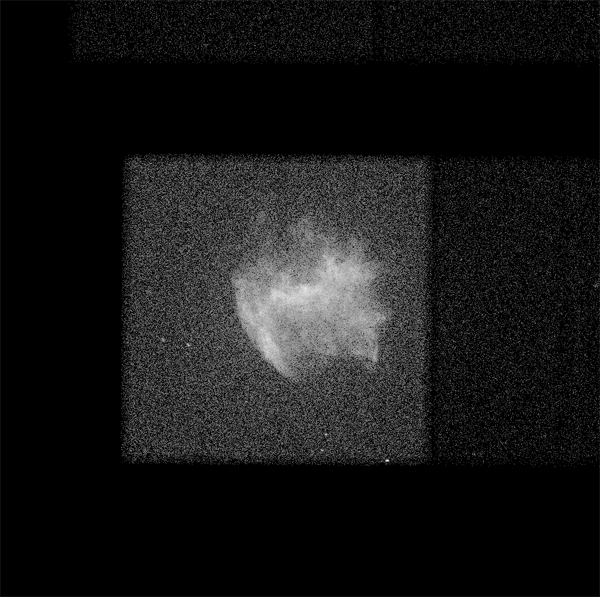
W49B raw data

Raw data from a single observation with Chandra. You can clearly see the CCD detectors illuminated by background radiation.
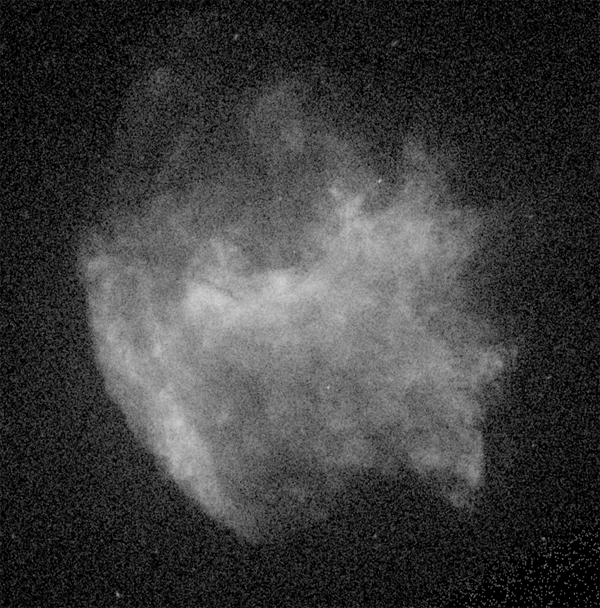
W49B merged data

Merging and calibrating data from several observations provides a clear improvement in signal to noise. This image combines more than 2.5 days worth of observation time.
W49B elements image

Here is one of the most interesting aspects of a deep data set with Chandra. The detector on Chandra not only records a photographic image, it also captures the energy of every single X-ray photon to reach the detector. Using this information, you can filter the data to make images in very specific energy ranges (similar to narrow band optical images). This image shows from left to right, images made in these elements emitting x-rays:
iron (~6.0-7.0 keV), calcium (~3.7-4.2 keV), argon (~2.9-3.4 keV), sulfur (~2.2-2.7 keV), and silicon (~1.7-2.1 keV).
W49B radio image

Here is the raw radio image provided by the Very Large Array.
W49B infrared image

Here's the ground-based infrared image from Palomar Observatory.
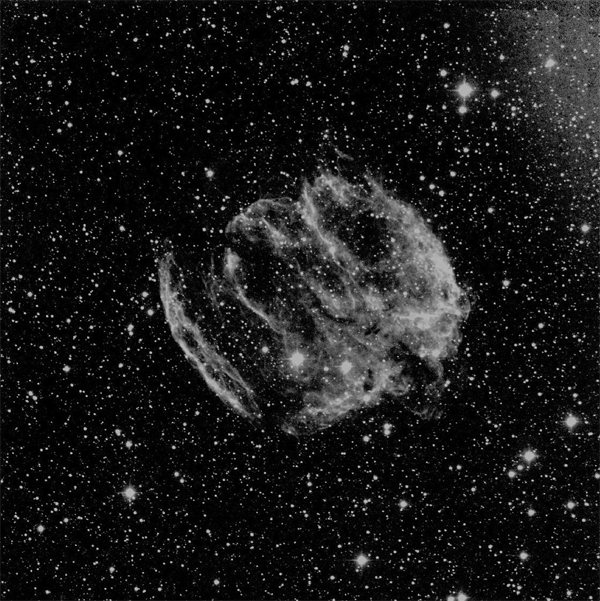
W49B optical image

To really blow your mind, take a look at this image which is roughly the same field of view as the others, only in optical light from the Digitized Sky Survey. This demonstrates the importance of a multi wavelength approach to astronomy. For anyone wanting to know what it would like to their "eyes" - this is it (if your eyes could integrate light).
-Joe DePasquale, Chandra Imager
Please note this is a moderated blog. No pornography, spam, profanity or discriminatory remarks are allowed. No personal attacks are allowed. Users should stay on topic to keep it relevant for the readers.
Read the privacy statement
